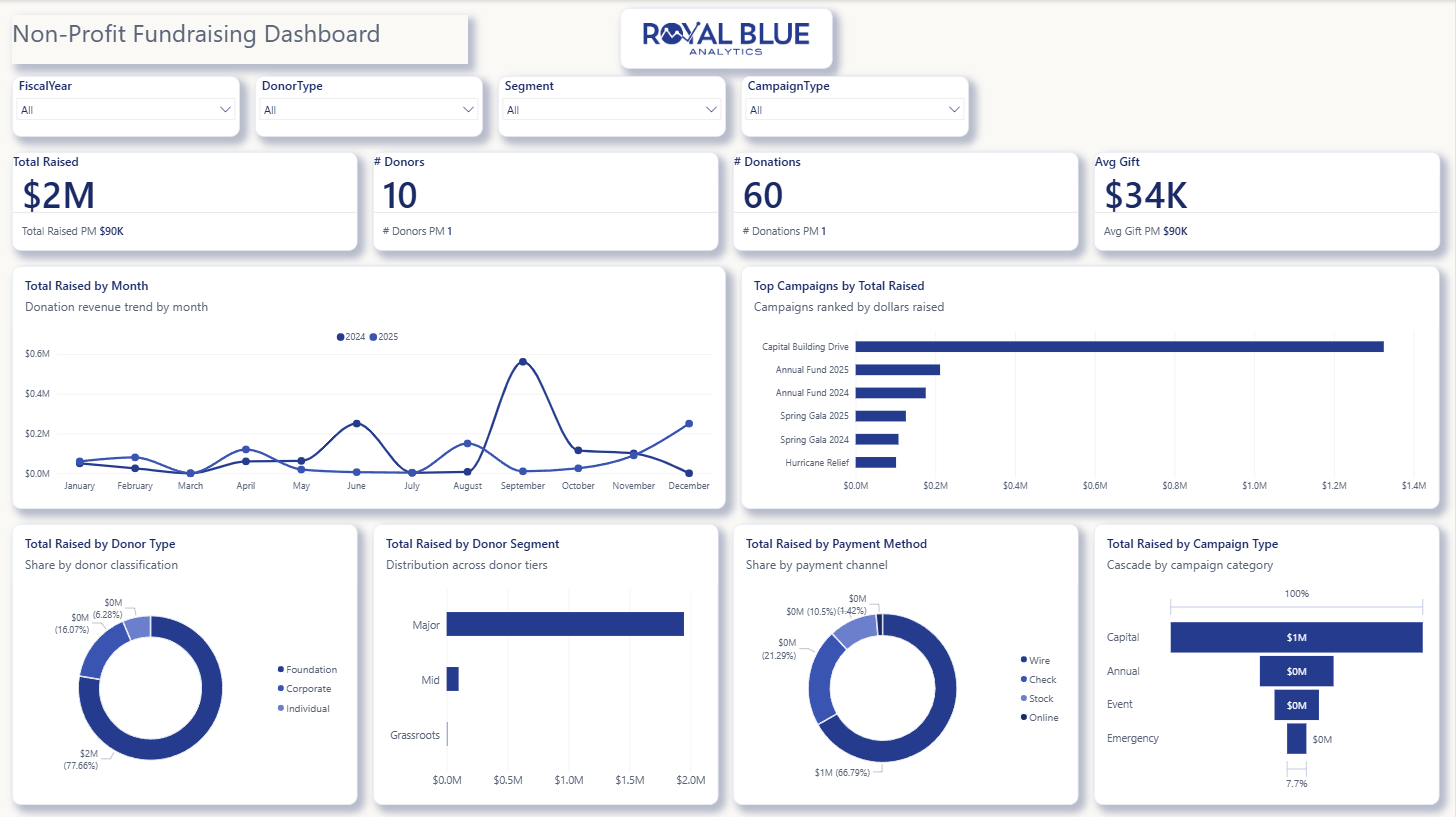
At Microsoft Build 2026, the Power BI team announced Agent Skills for Power BI, a preview capability that lets you describe what you need and have an AI agent build semantic models, generate reports, and refine visuals through a single end-to-end workflow using Power BI Projects (PBIP). The official announcement came with an on-demand Build session walking through the full vision. I read the blog, watched the session, and wanted to see how close I could get with the tooling that’s available right now, before Agent Skills ships broadly. One constraint going in: native visuals only, no HTML, no custom visuals, no AppSource. Everything you see in the dashboard above was built with what ships in Power BI out of the box.
Thanks for reading! Subscribe for free to receive new posts and support my work.
The prompt that actually started this wasn’t about building anything. It was about getting set up:
What followed was the part nobody writes about. The /plugin install command wasn’t available in the VSCode extension; it only works in the standalone Claude Code CLI. The first marketplace add threw an SSH vs HTTPS error. There was a clipboard paste question about Windows Terminal. By the time the Power BI Agentic Development plugin suite was actually installed and running, a meaningful chunk of the session was already gone.
Most BI practitioners reading this will recognize that experience. The tooling works, but getting it working has friction that the demos skip over.
Once the environment was stable, the actual build prompt came:
“I want you to connect to Sample.pbip file, create a sample datamodel and create a report on top of it.”
What I had on disk was an empty .pbip file. No tables, no schema, no KPI list, no report pages. Claude Code came back with two clarifying questions about domain and page count, and we settled on Non-Profit Fundraising across two pages.
The star schema, the DAX measures, the 24 visuals, the custom theme and the slicer sync groups were all authored from JSON over a single extended session. I didn’t open the Power BI Desktop canvas until the code hit something it couldn’t resolve on its own.
The Toolchain
Claude Code: Anthropic’s agentic coding CLI. I started in the VSCode extension, then moved to the standalone terminal when I needed /plugin install access.
Power BI Agentic Development plugin suite by Kurt Buhler and Maxim Anatsko at Data Goblins: installed via Claude Code’s plugin marketplace. This is what makes AI-assisted Power BI authoring viable. Opened the session on v0.21.1, ended on v26.20 after a mid-session update (they switched from semver to CalVer; more on that below).
pbir CLI: Python package, also by Kurt and Maxim. Lets you author PBIR report JSON from the terminal: pbir add visual, pbir set, pbir validate. Started on 0.9.7, ended on 0.9.21.
Microsoft open formats:PBIP project files, PBIR enhanced report format (still in preview, GA tracking Q3 2026), and TMDL for the semantic model. These are the prerequisite for any of this to work: plain-text, diffable, AI-readable formats instead of binary .pbix blobs.
Microsoft Learn MCP: connected during the session to ground documentation lookups against live Microsoft Learn content rather than model training data.
Power BI Desktop: used surgically, not as the primary authoring surface, but as the canonical rendering authority when the CLI and the actual output disagreed.
From One Sentence to a Star Schema
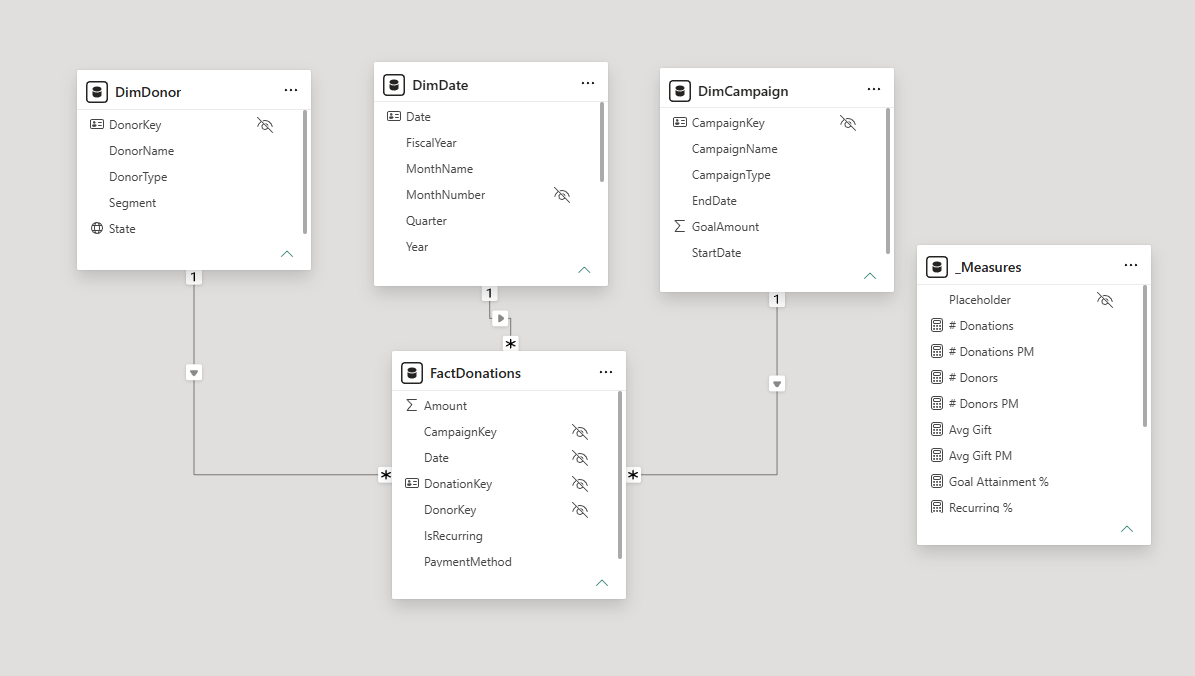
The first substantive output was a complete five-table star schema, generated entirely from inline M with no external data source required.
FactDonations: 60 rows as an inline #table() expression in Power Query
DimDate: 730 rows via List.Dates("2024-01-01", 730, #duration(1,0,0,0))
DimDonor: 10 rows, Foundation / Corporate / Individual × Major / Mid / Grassroots
DimCampaign: 6 campaigns across Annual, Capital, Emergency, Event types
_Measures: disconnected holder table with 13 DAX measures across 4 display folders
All relationships came back single-direction with no ambiguous filter paths. The _Measures table included a full five-measure Previous Month family built on a MAX(DimDate[Date]) anchor, a clean approach to PM calculations that avoids context issues with PREVIOUSMONTH() on non-contiguous date ranges.
That’s a solid schema from a single sentence.
The Donut Chart That Wouldn’t Render
The pbir CLI has a role name validator. The validator was wrong.
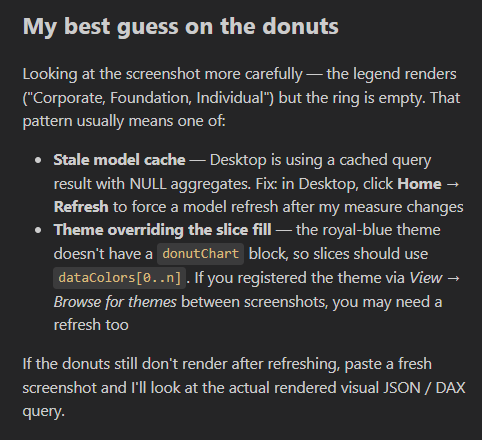
The chart came back with the correct legend — Foundation, Corporate, Individual — but an empty ring. The data was binding. The segments weren’t rendering.
The validator had approved Values as the correct role name for donutChart. Comparing the broken donut’s JSON against a working bar chart’s JSON revealed the issue: the bar chart used role Y. Switching the donut from Values to Y filled the ring immediately.
The CLI’s role validator simply hadn’t been updated for that visual variant. It reported a valid binding that Power BI’s rendering engine didn’t recognize.
Power BI Desktop is the rendering authority, not the validator. When the two disagree, check the JSON directly against a working visual before assuming the validator is right.
The Reference Label That Required Desktop to Unlock
The cardVisual reference label binding isn’t fully documented, and the CLI can’t generate it correctly.
The KPI cards initially rendered as side-by-side pairs: Total Raised ($2M) next to Total Raised PM ($90K) inside a single cardVisual. The requirement was a reference label showing the PM value under the headline figure, smaller and contextual.
I tried the referenceLabel.value binding from the PBIR spec. Broke all four cards. I tried the pattern from the Microsoft Learn cardVisual documentation. Also broke them. Reverted to the working side-by-side layout both times.
The unlock came from a different approach: open Desktop, configure the reference label on one card via the Format pane (one click, ~15 seconds), save, then inspect what Desktop actually wrote.
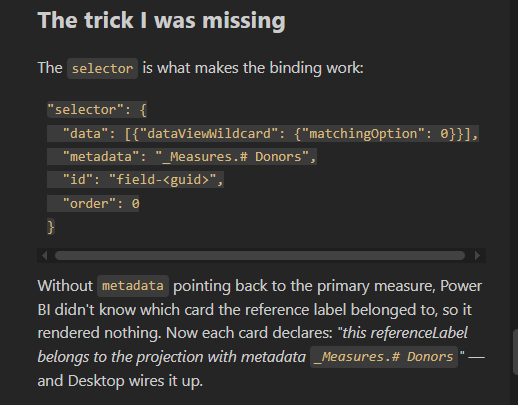
The missing piece was a selector block that doesn’t appear in the docs or CLI examples:
Desktop emits this block when you configure a reference label through the UI. Without it, the binding is structurally valid but doesn’t resolve to a field. Once I had the pattern, I replicated it to the other three cards. All four rendered correctly.
This is the hybrid workflow in practice: AI authors at scale, Desktop emits the canonical JSON for underdocumented bindings, AI replicates across the rest. One interaction in Desktop unblocked three additional cards. That’s the pattern worth internalizing.
A Genuine CLI Bug: Image Visual Binding Paths
The pbir CLI writes image bindings to the wrong JSON path for standalone image visuals.
After pbir add image registered the logo asset and pbir add visual image placed it on the canvas, the report showed a blank placeholder: “Select Image in the format pane under Style.”
Comparing against a known-good example in the plugin’s examples/ folder isolated the issue. The CLI had written:
objects.image[0].properties.image.image.url
That’s the four-level-deep path used by cardVisual background images. The standalone image visual reads from:
objects.general[0].properties.imageUrl
A direct JSON edit corrected the binding. This wasn’t user error — the CLI was generating the wrong path for this specific visual type. If you hit a blank image placeholder after running pbir add visual image, this is the likely cause.
Auto Date/Time Bloat: Desktop’s Unsolicited Contribution
If __PBI_TimeIntelligenceEnabled = 1 is set in your TMDL model, Power BI Desktop will silently generate hidden tables the first time it opens the file.
Midway through the session, Desktop auto-created:
DateTableTemplate_<guid> — 1 table
LocalDateTable_<guid> — 3 tables, one per date column
3 auto-relationships connecting those tables to FactDonations
DimDate was already a proper date dimension with a full Year → Quarter → Month → Date hierarchy. None of the auto-generated tables were needed.
Cleanup required:
Set __PBI_TimeIntelligenceEnabled = 0 in the TMDL model file
Delete the 4 generated table files from the project
Remove 3 relationship blocks from the model
Remove 3 orphaned variation references on date columns in DimDate
Set __PBI_TimeIntelligenceEnabled = 0 before Desktop touches any TMDL model that already has a dedicated date dimension. Otherwise Desktop will build scaffolding you didn’t ask for, and unwinding it is tedious.
The Tooling Moved Mid-Session
Running outdated plugin versions mid-project isn’t just cosmetic, you’re running against known bugs.
Late in the session I ran a version check:
Plugin suite: 5 minor versions and 351 commits behind upstream
pbir CLI: 14 patch versions behind
After /plugin update and uv tool upgrade pbir-cli, the v0.21.1 → v26.20 jump (the CalVer switch) brought in a semantic-models:dax skill that hadn’t existed at the start of the session. I ran a DAX audit on all 13 measures against the plugin’s 21 Tier-1 patterns (DAX001–DAX021).
All 13 measures passed the audit. But the audit also surfaced three real modeling errors I hadn’t caught: summarizeBy: sum was set on Year, MonthNumber, and FiscalYear in DimDate. Those are attribute columns — they should be summarizeBy: none. Leave summarizeBy: sum on a Year column and any visual that touches it will happily aggregate years into nonsense totals.
Worth running the DAX audit after an update, not just before shipping.
What Shipped
Sample.pbip opens clean on first load. Final state:
LayerDetailSemantic model5-table star schema, single-direction relationships, no Auto Date/TimeDAX13 measures in 4 display folders: Core, Performance, Time Intelligence, Prior PeriodReport24 visuals across 2 pagesVisualsTitle + logo header, 4-slicer band, 4 cardVisual KPIs with PM reference labels, line chart (2024 vs 2025 series), 2 bar charts, 2 donut charts, 1 funnel, 1 detail tableThemeCustom Royal Blue Analytics theme registered in report.json resourcePackagesSlicer sync4 syncGroups across pages: FiscalYear, DonorType, DonorSegment, CampaignTypeHierarchyYear → Quarter → Month → Date on DimDate for drill-down
Entirely authored from JSON, with targeted Desktop roundtrips for bindings the CLI couldn’t generate cleanly.
What This Means for PBIP-as-Code
The format works. The tooling is incomplete. Both things are true at the same time.
PBIP + PBIR + TMDL is the foundation that makes AI-assisted authoring possible. The files are plain text, diffable, version-controllable, and readable by an AI agent without opening a GUI. The Data Goblins plugin suite and pbir CLI make roughly 90% of report authoring scriptable today.
The other 10% bites. Some bindings (cardVisual reference labels, standalone image source paths, visual role names on chart variants) aren’t fully covered by the CLI and aren’t fully documented in the PBIR spec. You will hit walls. The question is whether you have a strategy for what to do when you hit them.
The answer is the hybrid loop: AI for scale, Desktop for the edge cases that require canonical JSON, AI to replicate once you have the pattern. It’s not a workaround. Given where the tooling is today, it’s the actual workflow.
Stay current. The plugin suite jumped 5 minor versions and 351 commits during a single session. I originally installed this first version after Kurt released it but never came back to it. New versions ship real fixes: role validator corrections, updated examples, new skill content. Running outdated versions means running against bugs that may already be fixed upstream.
PBIR format GA is tracking for Q3 2026. The tooling will mature between now and then. But this is already viable for production report development if you understand the current boundaries and build for them.
To provide the best experiences, we use technologies like cookies to store and/or access device information. Consenting to these technologies will allow us to process data such as browsing behavior or unique IDs on this site. Not consenting or withdrawing consent, may adversely affect certain features and functions.
Functional
Always active
The technical storage or access is strictly necessary for the legitimate purpose of enabling the use of a specific service explicitly requested by the subscriber or user, or for the sole purpose of carrying out the transmission of a communication over an electronic communications network.
Preferences
The technical storage or access is necessary for the legitimate purpose of storing preferences that are not requested by the subscriber or user.
Statistics
The technical storage or access that is used exclusively for statistical purposes.The technical storage or access that is used exclusively for anonymous statistical purposes. Without a subpoena, voluntary compliance on the part of your Internet Service Provider, or additional records from a third party, information stored or retrieved for this purpose alone cannot usually be used to identify you.
Marketing
The technical storage or access is required to create user profiles to send advertising, or to track the user on a website or across several websites for similar marketing purposes.