

Hello everyone!
This is part 2 of my Tableau LODs to Power BI Series. Click here to go to Part 1 of the series. Let’s get into it!
Find Min/Max in a Time Series
The goal is to display the min and max of a time series.
SQLBI.Com has a fantastic blog post on the method that I used to solve this. The key DAX functions that are being used are CALCULATETABLE, MINX, and MAXX. If you’re familiar with T-SQL and Subqueries then you “should” be able to follow what CALCULATETABLE and ADDCOLUMNS are doing. I also created a Calculated Column called “Order Month and Year” in order to get the dates in the MMM-YYYY format. This is very bad practice because you would typically use a date table in Power BI, but most tableau users aren’t used to using a date table so I decided to go this route. I used a line chart in Power BI and used the this DAX equation as a secondary value.
| Tableau | Power BI |
| Min Value // Minimum total sales for a given month {FIXED : MIN({FIXED DATETRUNC(‘month’, [Order Date]) : SUM([Sales])})} Max Value // Maximum total sales for a given month {FIXED : MAX({FIXED DATETRUNC(‘month’, [Order Date]) : SUM([Sales])})} Min or Max Sales // Find a point for the min and max sales. IF SUM([Sales]) = MIN([Min Value]) OR SUM([Sales]) = MAX([Max Value]) THEN SUM([Sales]) END | MinMax = VAR Vals = CALCULATETABLE( ADDCOLUMNS ( SUMMARIZE ( Orders, Orders[Order Month and Year]), “@SalesAmt”, [Total Sales] ), ALLSELECTED () ) VAR MinValue = MINX ( Vals, [@SalesAmt] ) VAR MaxValue = MAXX ( Vals, [@SalesAmt] ) VAR CurrentValue = [Total Sales] VAR Result = SWITCH ( TRUE, CurrentValue = MinValue, [Total Sales], — 1 for MIN CurrentValue = MaxValue, [Total Sales] — 2 for MAX ) RETURN Result |
Tableau

Power BI

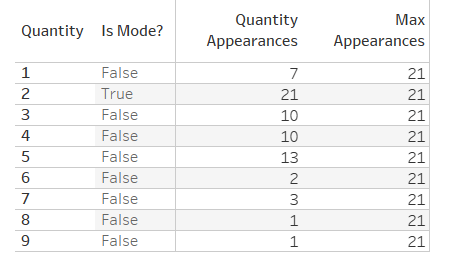
Calculate The Mode
The mode of a set of numbers is the one that appears most frequently. The goal is determine with value has the most appearances.
| Tableau | Power BI |
| 8. Quantity Appearances = var __slicer = SELECTEDVALUE(Orders[Sub-Category]) return CALCULATE(COUNTROWS(Orders) , ALLEXCEPT(Orders,Orders[Quantity] ) ,Orders[Sub-Category] = __slicer ) | |
| Max Appearances // Get the max appearances of a given quantity. {FIXED : MAX({FIXED [Quantity]: SUM([Number of Records])})} | 8. Max Appearances = var __slicer = SELECTEDVALUE(Orders[Sub-Category]) return CALCULATE(MAXX(Orders,[8. Quantity Appearances]), ALL(Orders), Orders[Sub-Category] = __slicer ) |
| Is Mode? // Is this number the mode? // Note: Could be multiple modes. IF {FIXED [Quantity]: SUM([Number of Records])} = [Max Appearances] THEN TRUE ELSE FALSE END | Is Mode = if ([8. Quantity Appearances] = [8. Max Appearances], TRUE() ,FALSE() ) |

Compare Subset to Superset
In this example are comparing a subset to the entire set. We are want to see what the average sales are by state in comparison to the national average. In this example I leveraged the FORMAT and ABS variables to get the format I wanted. I also used the unichar characters in my switch statement in order to the get the arrows. This is a very fast solution and probably isn’t best practice but I wanted to test out my DAX versatility.
| Tableau | Power BI |
| National Average Sales // Average sales amount for the entire country. {FIXED [Country/Region]: AVG([Sales])} | 14. National Average Sales = CALCULATE(AVERAGE(Orders[Sales]), ALLEXCEPT(Orders,Orders[Country/Region])) |
| 14. Average Sales from Variance = VAR __variance = AVERAGE ( Orders[Sales] ) – [14. National Average Sales] VAR __kpi = SWITCH ( TRUE (), __variance < 0, UNICHAR ( 11205 ), UNICHAR ( 11206 ) ) RETURN FORMAT ( ABS ( __variance ), “$#,###” ) & ” “ & __kpi |

